What is GRR Study?
→ GRR Study is also known as the Gauge R&R Study.
→ The full name of GRR Study is Gauge Repeatability and Reproducibility Study.
→ This is a part of variable MSA study. MSA stands for the measurement system analysis.
→ MSA is very famous in an automobile domain.
→ This study helps us to identify about the capability of the appraiser and measuring instrument.
→ In very simple way we can say that this study is very useful to determine the accuracy of the measurement system.
→ Measurement system is the combination of the measuring instrument and the appraiser.
→ Appraiser is the person who perform the GRR study.
→ GRR Study is the standard method within the manufacturing sector.
→ Also, You can check here, Different Six Sigma Project Templates Download
Example of the GRR Study with Excel Template
→ Refer to the below example of the GRR study.
→ In this example we have taken 3 appraiser and the 10 parts.
→ Each appraiser will perform the 3 times measurement for all 10 parts in ascending, descending, and random order.
→ For detailed rules for performing GRR Study refers to the AIAG MSA Manual.
→ This template is very easy to use and very impressive and editable.
→ Also, very attractive graphs are also added into this template.
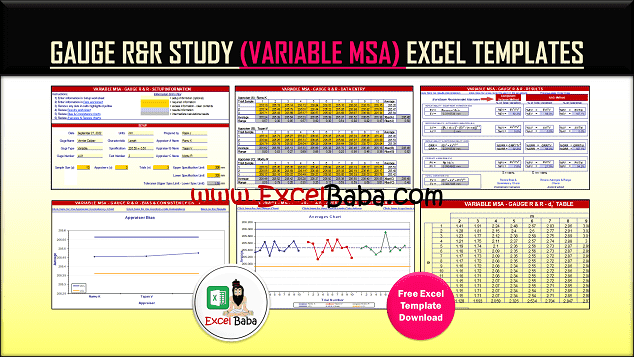
→ This template contains multiple excel worksheets and navigation links are provided to all pages to navigate between all work sheets.
➨ Gauge R&R Study template contains below sections
- Setup Information
- Data Entry
- Results
- Bias & Consistency Charts
- Ave & Range Charts
- Critical Values
- d2star Table
1) Setup Information
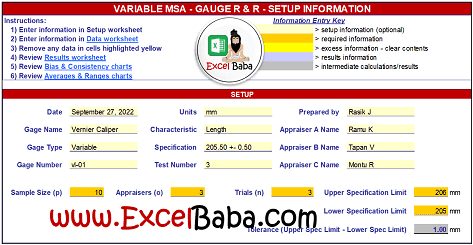
→ In this section we need to enter all the basic setup details for the Gauge R&R Study.
→ This information contains basic details such as Date, Units of Measurement, Prepared by, Gage Name, Characteristic of Measurement, Appraiser A Name, Gage Type, Specification, Appraiser B Name, Gage Number, Test Number, Appraiser C Name, etc
2) Data Entry
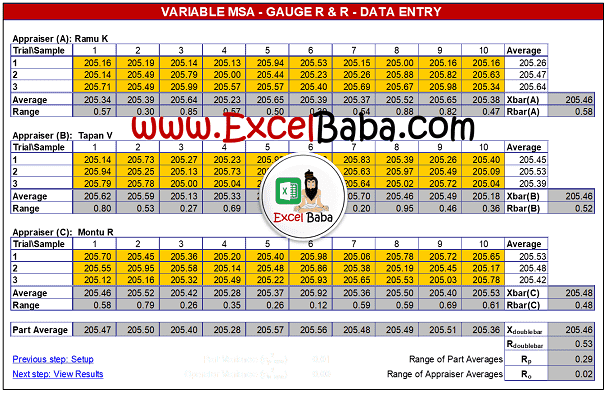
→ After the entering basic setup details we need to enter the data into the In data entry sheet.
→ This sheet contains the provision of entering3 appraiser, 10 parts 3 trials details.
→Also, Individual average, part average, individual range, and part range formula given for automatic calculation.
→ Also, you will find the navigation link for previous and next sheet.
→ You can also refer to the Lean Six Sigma Project Charter Excel Template.
3) Results
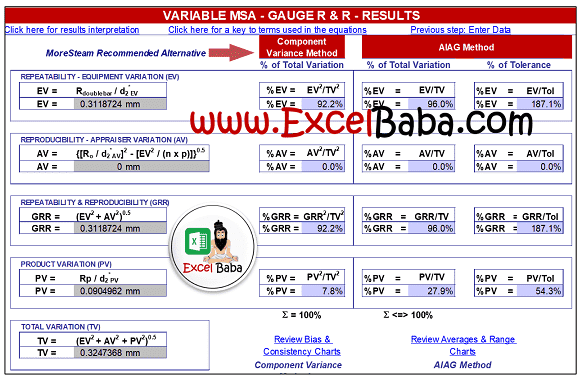
→ After data entry, now its turn of result sheet.
→ In result sheet, we have pre-defined formula for automatic calculations of all parameters that is required such as equipment variation, appraiser variation, Part Variation, Repeatability & Reproducibility (GRR), Total Variation, etc.
4) Bias & Consistency Charts
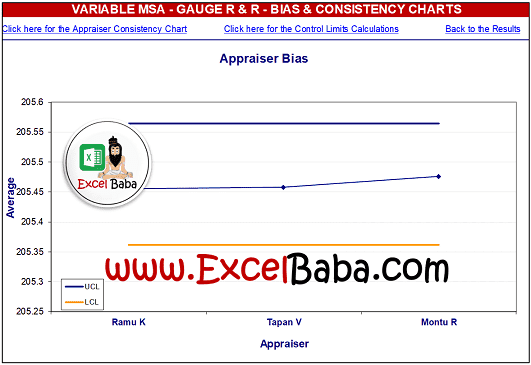
→ In this excel sheet you will get automatically constructed different charts based on the data input into the data entry sheet.
→ There are two different charts are available the 1st one is appraiser Bias, and second one is appraiser consistency
5) Ave & Range Charts
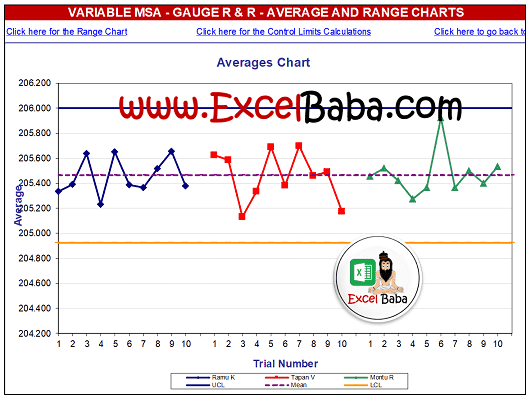
→ After Bias & Consistency Charts we have Ave & Range Chart Excel work sheet.
→ In this chart we can easily study about the average chart and range chart of the trials.
→ All charts are automatic so we just need to enter the data into the data entry sheet and we will get the chart automatically.
6) Critical Values
→ In Critical Values sheet there are all critical necessary values are given.
→ Critical values are taken for the various calculations
→ All these values are depends on Appraisers, Number of trials, and k = # of measurements per trial (m x n)
7) d2star (d2*) Table
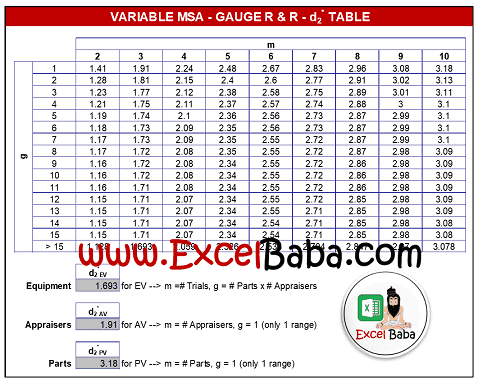
→ In d2star Table sheet, the constant value of the d2* is given.
→ This value is also depends on the number of trials, number of parts, and number of operators.
👉 Get Variable MSA Excel Template
👉 For a regular update:
➨ Join us (Telegram Channel)
➨ Join us (LinkedIn Page)
👉 Also Navigate Our Popular Category:
➨ Lookup & Reference Functions


Post a Comment