What is Case and Effect Diagram?
→ A Cause and Effect Diagram is a visual tool used to identify and organize possible causes for a specific problem.
→ It is also known as a Fishbone Diagram.
→ This diagram has two parts that are cause and effect.
→ In the diagram right-hand side we need to mention the effect or problem description.
→ And on the left-hand side, we need to mention the potential causes that are probably relevant to the effect or problem.
→ The causes we can list down with the help of the CFT members and brainstorming method.
→ This is a very good graphical tool for displaying the potential causes of the problem or effect.
→ This tool is further used for the Root Causes Analysis.
→ Also, You can check here, Different Six Sigma Project Templates Download
→ Our 7 QC Tools templates include Pareto Chart, Scatter Diagram, Histogram, Check Sheet, Control Chart, Cause and Effect Diagram Excel template, and Flow Chart.
Cause and Effect Diagram Example
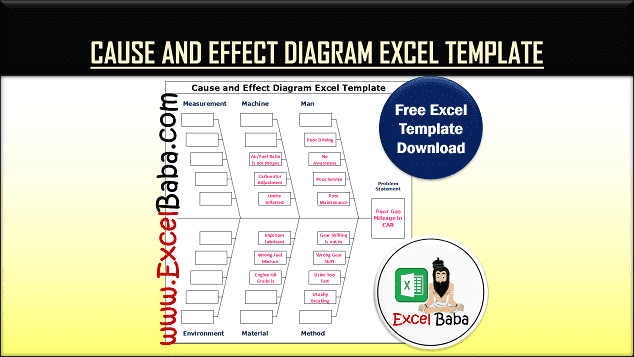
→ A simple cause and effect diagram is shown in the below picture.
→ In this example we have taken "poor car mileage" as a problem or effect statement.
→ Now we need to identify why this happens.
→ So for that, we need to identify the potential causes that we need to mention on the left side of this diagram.
→ The potential causes need to categorize into six different types that are known as a 6M
➨ The 6M for Cause & Effect Diagram is mentioned below
- Man
- Machine
- Material
- Method
- Measurement
- Mother Nature (Environment)
→ So as we can see from the below picture there are multiple potential causes are mentioned in the different headers out of 6M.
→ After validation and brainstorming with Cross Function Team members we can identify the actual root cause of our problem or effect.
→ You can also refer to the Lean Six Sigma Project Charter Excel Template.
Cause and Effect Diagram Process Steps
→ Refer to the below steps for making the Cause and Effect Diagram
- Define the Effect or Problem
- Note Down into the Right Side
- Identify the Possible Causes/Potential Causes
- Note Down Main Causes into the Left Side
- List Out the Sub Causes
- Validation of Each Cause
- Identify the Actual Cause
(1) Define the Effect or Problem
→ In the very first step, we need to define the problem or effect
→ We can use 5W2H concepts to define the problem
(2) Note Down into the Right Side
→ After the finalization of the problem statement, we need to mention on the right side
→ The statement should be very clear and concise
(3) Identify the Possible Causes/Potential Causes
→ Now we need to identify the possible causes, for that we can use the brainstorming method.
→ We can use team brainstorming or we can ask one by one to all person.
(4) Note Down Main Causes into the Left Side
→ Now in this step, we need to note down the main causes on the left side of this diagram.
→ During noting down we need to divide all causes into six different categories as Man, Machine, Material, Method, Measurement, and Mother Nature (Environment).
(5) List Out the Sub Causes
→ After noting down the potential causes, now we need to add more sub-causes for each potential/main cause if it is available and possible.
(6) Validation of Each Cause
→ Till now we have completed the five steps for the Cause and Effect Diagram construction.
→ Now it's time to validation of each possible cause.
→ In this step, we will validate one by one each cause whether that cause has a relation with the effect/problem or not.
(7) Identify the Actual Cause
→ After completing the validation we can have the actual cause that has a meaningful relationship with the problem.
👉 Get Cause and Effect Diagram Excel Template
👉 For a regular update:
➨ Join us (Telegram Channel)
➨ Join us (LinkedIn Page)
👉 Also Navigate Our Popular Category:
➨ Lookup & Reference Functions


Post a Comment